2012-05-30
Explanation
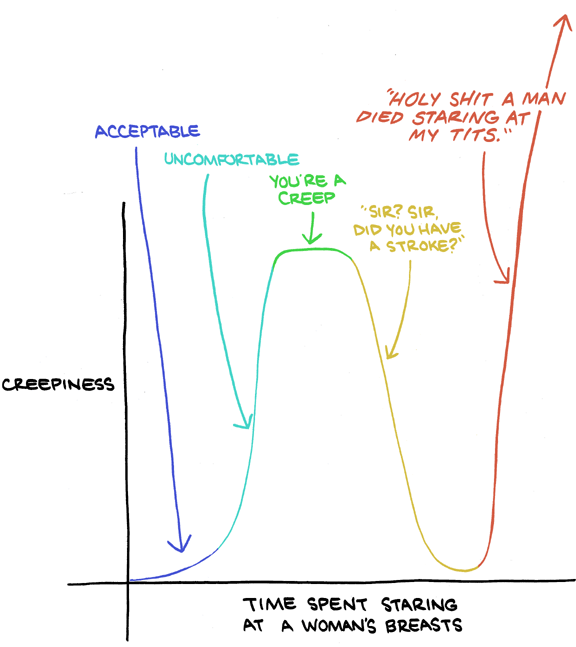
This comic presents a graph plotting "Creepiness" (y-axis) against "Time spent staring at a woman's breasts" (x-axis), showing how social perception changes as staring duration increases. The curve starts at "Acceptable" for a brief glance, quickly rises to "Uncomfortable," then peaks at "You're a creep." But then the graph takes an unexpected turn -- creepiness drops back down through a phase labeled "Sir? Sir, did you have a stroke?" (where concern for the person's health overrides the creepiness) before shooting back up to maximum creepiness with "Holy shit a man died staring at my tits."
The humor comes from the non-monotonic shape of the curve -- the idea that there's a sweet spot of staring duration where it actually becomes less creepy because the behavior is so extreme it can only be explained by a medical emergency. The joke plays with the mathematical/scientific convention of graphing social phenomena, applying rigorous-looking analysis to an absurd subject. It also follows a classic SMBC pattern of taking a simple observation (staring is creepy) and extending it to ridiculous extremes to find unexpected logical consequences. The final spike in creepiness at the far right -- dying while staring -- suggests that even posthumously, the act manages to be disturbing in a whole new way.