Detection

Explanation
The Joke
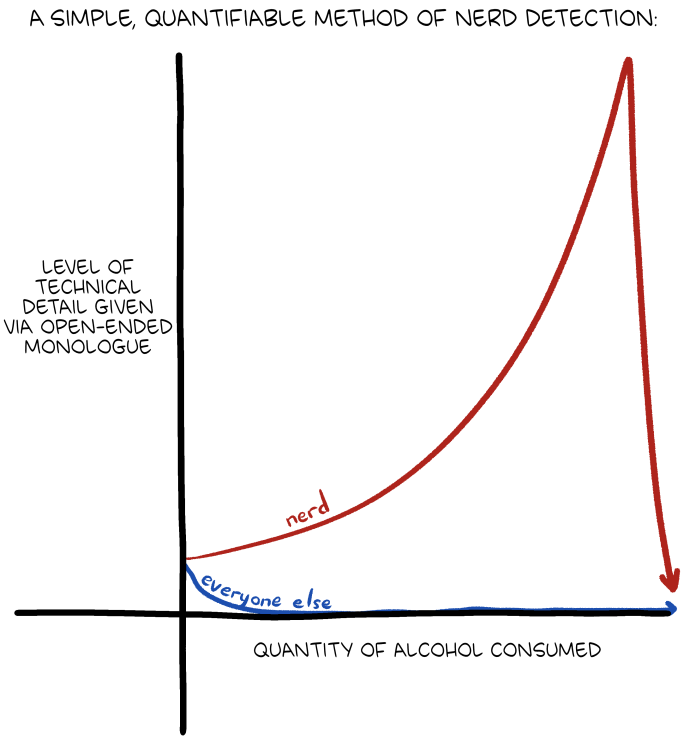
The comic presents a graph titled "A Simple, Quantifiable Method of Nerd Detection." The x-axis shows "Quantity of Alcohol Consumed" and the y-axis shows "Level of Technical Detail Given Via Open-Ended Monologue." Two curves are plotted: one labeled "everyone else" (in blue) which stays flat and low regardless of alcohol consumption, and one labeled "nerd" (in red) which rises dramatically as alcohol intake increases, reaching a towering peak before crashing back down (presumably when the nerd passes out).
The joke is that while normal people might become more talkative or emotional when drinking, nerds specifically become increasingly prone to delivering unsolicited, highly technical monologues about their areas of expertise. The more a nerd drinks, the more detailed and intense these monologues become -- until they reach a point of total collapse.
The Humor
The humor relies on the absurdity of presenting a well-known social observation in the form of a rigorous-looking scientific graph, complete with clearly labeled axes. This is itself a nerdy thing to do, making the comic self-referentially funny. The observation rings true for anyone who has been at a party where a few drinks in, the quiet engineer or scientist suddenly corners someone to explain quantum mechanics or compiler design in excruciating detail. The sharp spike and crash of the "nerd" curve is also funny -- it suggests there's a very narrow window of extreme technical verbosity before the nerd simply shuts down entirely. The "everyone else" line staying essentially flat is the perfect deadpan contrast.
References
The comic plays on the stereotype of nerds and technical professionals who become disproportionately talkative about their specialized interests when their social inhibitions are lowered by alcohol. The graph format itself parodies scientific data visualization, which is fitting given the subject matter.