time-3

Explanation
The Joke
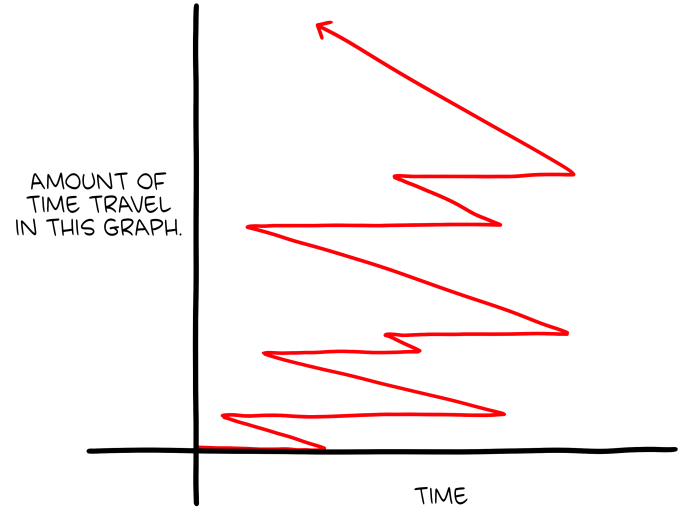
The comic is a self-referential graph. The Y-axis is labeled "Amount of Time Travel in This Graph" and the X-axis is labeled "Time." The red line on the graph starts at zero and moves forward in time, but then begins zigzagging backward and forward -- literally traveling back in time within the graph itself. The line's path creates a paradox: as it moves backward along the time axis, it increases the amount of time travel occurring in the graph, which in turn should be reflected on the Y-axis.
The graph is a visual paradox where the data being plotted (time travel) is enacted by the very line doing the plotting. The line doesn't just represent time travel -- it performs time travel by moving leftward (backward in time) on the X-axis.
The Humor
This is a meta-humor joke in the style of self-referential mathematical puzzles. The comedy comes from the elegant absurdity of a graph that describes itself -- and specifically describes itself doing something impossible. It's reminiscent of Douglas Hofstadter's strange loops or the liar's paradox, but expressed as a simple chart. The visual punchline is immediate: you can see the line traveling backward in time, which is exactly what the graph claims to be measuring. It's the kind of joke that particularly appeals to math and physics enthusiasts who appreciate formal self-reference.
References
This comic is in the tradition of self-referential infographics, similar to xkcd's self-describing charts. The concept of time travel paradoxes (bootstrap paradoxes, causal loops) is a staple of science fiction and physics thought experiments.